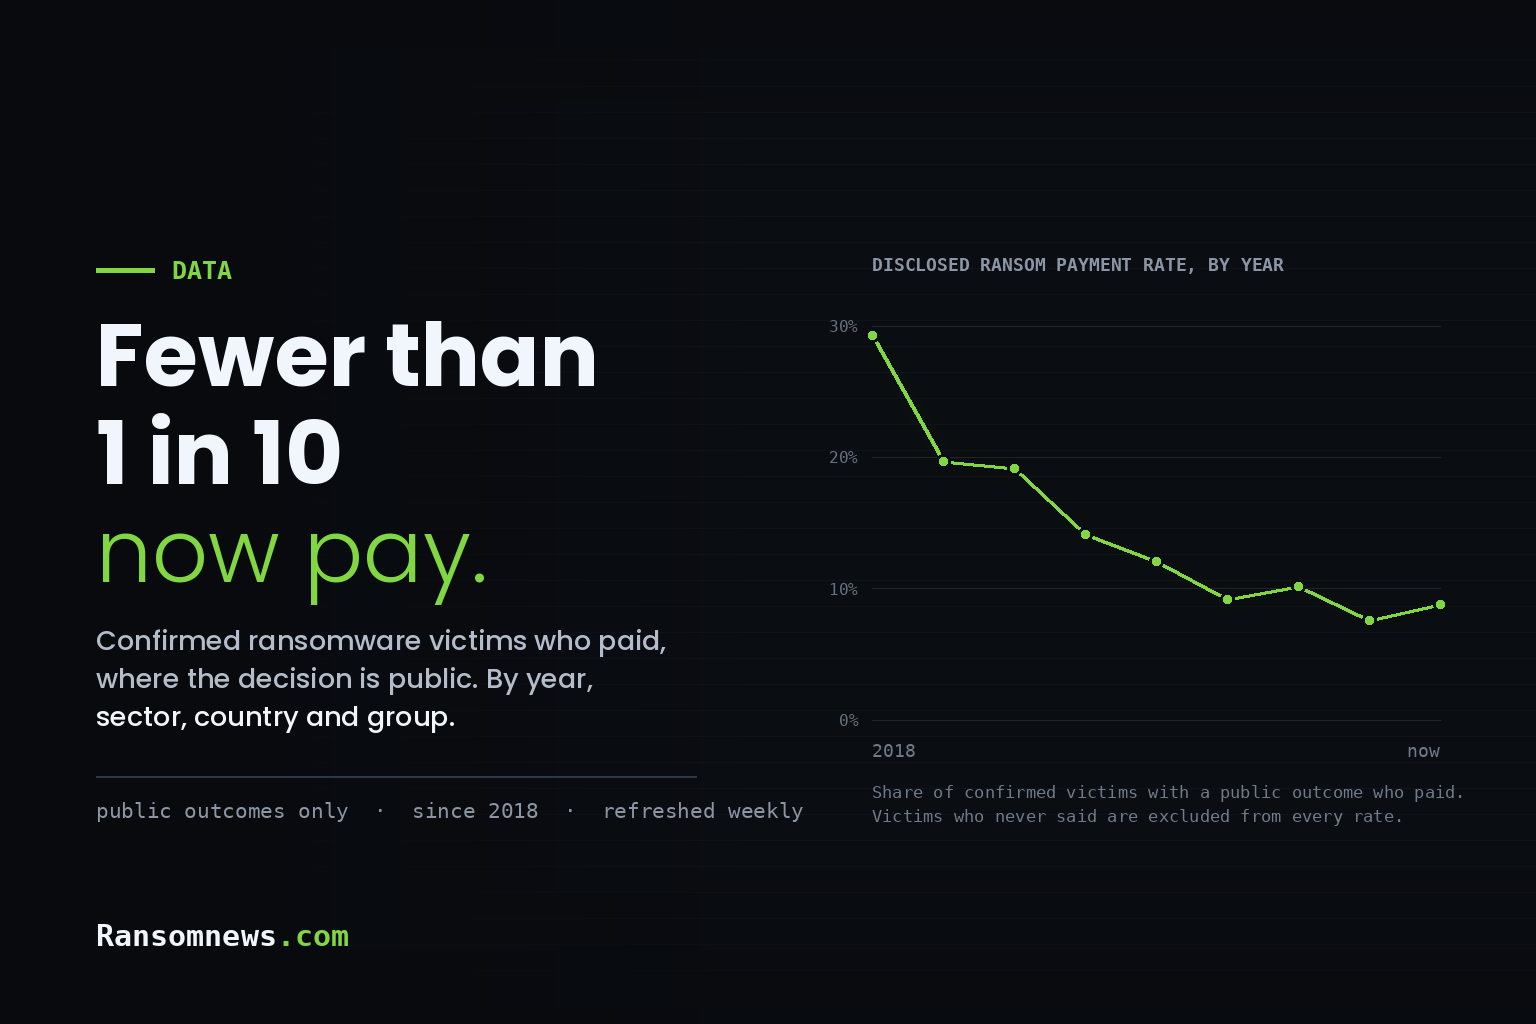
Among the 1,772 confirmed ransomware attacks since 2018 where the victim's decision is on the public record, 247 paid and 1,525 refused, a disclosed payment rate of 13.9%. That rate has fallen from 29.3% in 2018 to 8.2% in 2025, and stands at 8.9% so far in 2026 (79 incidents with a public outcome). The full dataset holds 9,715 confirmed incidents from January 2018 to October 2026; for 7,943 of them (81.8%) no public statement on payment exists either way. All figures on this page are recalculated from the live database.
By the Ransomnews Research Team. Every table on this page recalculates from the live database on each load. Dataset last refreshed 8 October 2026.
That is the disclosed payment rate: the share of victims who paid among those whose decision made it onto the public record. It is not the true payment rate, and this article spends some time on the difference, because the gap between the two is where most bad ransomware statistics come from. What the disclosed rate does show, clearly and across every cut of the data, is direction. Whichever way the 9,520 confirmed incidents are sliced, by year, by sector, by country or by operator, fewer victims are willing to say they paid, and the ones who refuse are more willing to say so.
The payment rate in numbers
Figures below are as of 4 September 2026. The tables on this page recalculate from the live database, so they will drift from the prose as the dataset grows.
- Disclosed payment rate, 2018: 29.3% (22 paid, 53 refused, 75 known outcomes).
- Disclosed payment rate, 2025: 7.6% (11 paid, 134 refused, 145 known outcomes).
- Disclosed payment rate, 2026 to August: 8.8% (5 paid, 52 refused, 57 known outcomes).
- Pooled 2018 to 2019 against 2024 to 2026: 22.1% down to 9.0%, a fall of roughly three fifths.
- Highest-paying sector: law firms, 38.7% of known outcomes. Lowest: utilities, 3.6%.
- Median ransom figure where one was reported: $250,000 in cases that paid, $700,000 in cases that refused.
- Share of incidents with any public statement on payment: 44.6% in 2018, 8.2% in 2026.
What the payment rate measures, and what it does not
Every incident in the Ransomnews Confirmed Ransomware Attacks Dataset was verified against a public source: a breach notification, a regulatory or court filing, an official statement, or credible press reporting. For each one we record whether the victim paid, if a source says so. Most sources do not. Of 9,520 confirmed incidents between January 2018 and August 2026, only 1,748 carry a public statement either way. In 244 of those the victim paid. In 1,504 the victim refused, or said it had restored from backups without paying, or a filing recorded that no payment was made.
The disclosed payment rate is simply 244 divided by 1,748, which is 14.0% across the whole period. Two biases push that number in opposite directions and both need saying plainly. Organisations that pay have every reason to keep quiet, so payers are under-counted. Public bodies are the most likely to announce a refusal, because refusing is the policy and announcing it is politically useful, so refusals are over-counted. The disclosed rate is therefore a floor on refusals and a poor guide to what a private company actually does at 3am with its systems down. What it is good for is comparison over time and between groups, because those biases are reasonably stable while the number underneath them moves.
Incidents with no public statement are never in the denominator. That matters for reading the tables: a year with 1,469 confirmed attacks and 145 known outcomes has a rate computed on 145, not 1,469.
The disclosed payment rate by year
| Year | Confirmed attacks | Outcome public | Share public | Paid | Refused | Disclosed payment rate |
|---|---|---|---|---|---|---|
| 2018 | 168 | 75 | 44.6% | 22 | 53 | 29.3% |
| 2019 | 458 | 222 | 48.5% | 44 | 178 | 19.8% |
| 2020 | 1,228 | 235 | 19.1% | 45 | 190 | 19.1% |
| 2021 | 1,436 | 311 | 21.7% | 44 | 267 | 14.1% |
| 2022 | 959 | 224 | 23.4% | 27 | 197 | 12.1% |
| 2023 | 1,551 | 292 | 18.8% | 27 | 265 | 9.2% |
| 2024 | 1,550 | 187 | 12.1% | 19 | 168 | 10.2% |
| 2025 | 1,489 | 147 | 9.9% | 12 | 135 | 8.2% |
| 2026 (to date) | 876 | 79 | 9% | 7 | 72 | 8.9% |
The slope is the story. In 2018, roughly three victims in ten with a public outcome had paid. By 2021 it was one in seven, by 2023 fewer than one in ten, and 2025 closed at 7.6%. The 2024 uptick to 10.2% and the 2026 figure of 8.8% are both within the noise of samples this size; 2026 rests on 57 known outcomes and will move as the year fills in. Pooling the edges removes that noise: 66 of 298 known outcomes in 2018 and 2019 were payments, 22.1%, against 35 of 389 in 2024 to 2026, 9.0%.
The “share public” column deserves its own look. In 2018 nearly half of confirmed incidents carried a statement about payment. In 2026 it is one in twelve. Part of that is the dataset’s growth: the yearly confirmed count rose almost ninefold between 2018 and 2025 while the number of victims prepared to discuss payment did not. Part of it is a change in how victims disclose. Breach notification letters, which now supply a large share of confirmed incidents through state attorney general portals, describe what data was taken and almost never mention the ransom. The public record on payment is thinning even as the record of attacks thickens.
Is the drop real, or is it a change in who talks?
A fair objection: if the mix of victims willing to disclose has shifted toward public bodies that refuse on principle, the rate would fall without any change in private behaviour. Government does account for 664 of the 1,748 known outcomes, the largest single block, and its disclosed rate is 8.9%. So the table below removes it.
| Year | Confirmed attacks | Outcome public | Share public | Paid | Refused | Disclosed payment rate |
|---|---|---|---|---|---|---|
| 2018 | 110 | 38 | 34.5% | 11 | 27 | 28.9% |
| 2019 | 305 | 113 | 37% | 32 | 81 | 28.3% |
| 2020 | 1,072 | 163 | 15.2% | 34 | 129 | 20.9% |
| 2021 | 1,261 | 213 | 16.9% | 37 | 176 | 17.4% |
| 2022 | 787 | 128 | 16.3% | 19 | 109 | 14.8% |
| 2023 | 1,313 | 194 | 14.8% | 23 | 171 | 11.9% |
| 2024 | 1,345 | 111 | 8.3% | 17 | 94 | 15.3% |
| 2025 | 1,277 | 90 | 7% | 8 | 82 | 8.9% |
| 2026 (to date) | 726 | 47 | 6.5% | 5 | 42 | 10.6% |
The decline survives. With government excluded, the disclosed rate was 28.9% in 2018 and 28.1% in 2019, then 21.0%, 17.4%, 14.7%, 12.0%, 15.2%, 8.9% and 11.8% so far this year. Business, healthcare and education victims are refusing more often, and saying so more often, in roughly the same proportion as the dataset overall.
Geography is the other suspect. Splitting the known outcomes into United States and everywhere else, the US disclosed rate fell from 24.2% in 2018 to 2020 (89 of 368) to 19.0% in 2024 to 2026 (26 of 137). Outside the US it fell from 13.4% (22 of 164) to 3.6% (9 of 252). Both halves fell, but the non-US half fell further and grew from a third of known outcomes to nearly two thirds, which drags the headline rate down faster than either half on its own. Read the overall series as a floor and the US series as the more conservative estimate of change: a fall of roughly a fifth in disclosed payments, rather than the two thirds the headline number implies.
Which sectors pay
| Sector | Confirmed attacks | Outcome public | Paid | Refused | Disclosed payment rate |
|---|---|---|---|---|---|
| Legal | 251 | 31 | 12 | 19 | 38.7% |
| Technology | 574 | 87 | 21 | 66 | 24.1% |
| Finance | 643 | 68 | 16 | 52 | 23.5% |
| Service | 690 | 54 | 10 | 44 | 18.5% |
| Healthcare | 1,676 | 309 | 52 | 257 | 16.8% |
| Transportation | 270 | 31 | 5 | 26 | 16.1% |
| Education | 1,004 | 209 | 33 | 176 | 15.8% |
| Retail | 523 | 46 | 6 | 40 | 13% |
| Food and Beverage | 353 | 41 | 5 | 36 | 12.2% |
| Government | 1,519 | 675 | 61 | 614 | 9% |
| Manufacturing | 1,070 | 101 | 9 | 92 | 8.9% |
| Utilities | 218 | 25 | 1 | 24 | 4% |
Law firms sit at the top with 12 payments in 31 known outcomes, 38.7%. The sample is small but the logic is not hard to see: a firm’s leverage is client confidentiality, the stolen data is the client’s, and a firm that lets it leak has a professional problem that outlasts any recovery. Technology and finance follow at 23.5% each, healthcare at 17.1% on the largest commercial sample, 304 known outcomes. At the other end, utilities disclosed a payment once in 28 known outcomes, manufacturing nine times in 102, and government 59 times in 664. Those three share a trait: their disruption is visible and their recovery is usually a rebuild, not a decryption. The pages on healthcare, government, law firms and the other sectors carry the full incident lists behind these rates.
Which countries pay
| Country | Confirmed attacks | Outcome public | Paid | Refused | Disclosed payment rate |
|---|---|---|---|---|---|
| United States | 5,198 | 811 | 179 | 632 | 22.1% |
| France | 505 | 128 | 1 | 127 | 0.8% |
| Germany | 416 | 92 | 3 | 89 | 3.3% |
| Japan | 379 | 28 | 1 | 27 | 3.6% |
| Canada | 356 | 92 | 17 | 75 | 18.5% |
| United Kingdom | 321 | 61 | 4 | 57 | 6.6% |
| Australia | 234 | 36 | 3 | 33 | 8.3% |
| Italy | 219 | 60 | 0 | 60 | 0% |
| Brazil | 157 | 33 | 2 | 31 | 6.1% |
| Spain | 148 | 34 | 1 | 33 | 2.9% |
| Switzerland | 123 | 48 | 4 | 44 | 8.3% |
| Netherlands | 106 | 37 | 15 | 22 | 40.5% |
| Denmark | 63 | 24 | 1 | 23 | 4.2% |
| Belgium | 62 | 24 | 2 | 22 | 8.3% |
Country rates are where disclosure rules show most. The United States has 803 known outcomes, 46% of the total, at a disclosed rate of 22.2%; its notification laws force incidents onto the record but do not force silence on payment, so American companies are the ones most often on record as having paid. France has 128 known outcomes and a single disclosed payment, 0.8%. That is not evidence that French companies refuse. It is evidence of who discloses in France: 125 of its 503 confirmed incidents are public bodies, which supply 72 of the 128 known outcomes and refuse as a matter of state policy, while French companies that paid have no obligation to say so and do not. Italy is 0 for 59 for the same reason. The Netherlands, at 15 payments in 37 known outcomes, is the outlier in the other direction, on a sample small enough that a handful of candid disclosures explains it.
Which groups get paid
| Ransomware group | Confirmed attacks | Outcome public | Paid | Refused | Disclosed payment rate |
|---|---|---|---|---|---|
| REvil | 149 | 21 | 7 | 14 | 33.3% |
| Black Basta | 174 | 20 | 4 | 16 | 20% |
| Ryuk | 91 | 46 | 9 | 37 | 19.6% |
| Akira | 311 | 27 | 5 | 22 | 18.5% |
| Conti | 269 | 47 | 7 | 40 | 14.9% |
| ALPHV/BlackCat | 217 | 34 | 3 | 31 | 8.8% |
| LockBit | 545 | 115 | 10 | 105 | 8.7% |
| Maze | 170 | 22 | 1 | 21 | 4.5% |
| Play | 223 | 23 | 1 | 22 | 4.3% |
| DoppelPaymer | 94 | 24 | 1 | 23 | 4.2% |
| Rhysida | 120 | 26 | 1 | 25 | 3.8% |
| Qilin | 346 | 32 | 0 | 32 | 0% |
| INC | 217 | 20 | 0 | 20 | 0% |
| RansomHub | 166 | 23 | 0 | 23 | 0% |
| Medusa | 161 | 24 | 0 | 24 | 0% |
| Vice Society | 82 | 28 | 0 | 28 | 0% |
This table reads like a timeline. The operators with the highest disclosed rates are the ones from the affiliate boom of 2019 to 2021: REvil at 33.3% of 21 known outcomes, Ryuk at 19.6% of 46, Conti at 14.9% of 47. The operators that dominate confirmed victim counts now sit at the bottom. Among confirmed victims with a public outcome, no victim of Qilin (30 known outcomes), INC (20), RansomHub (23), Medusa (23) or Vice Society (28) has disclosed paying. LockBit, the largest operation in the dataset by confirmed victims, has 10 payments in 115 known outcomes, 8.7%. Akira, at 19.2% of 26, is the one current-generation group with a rate in the old range, which matches its reputation for hitting mid-sized firms with working encryption rather than relying on data theft alone.
Zero is a floor, not a fact about behaviour. Qilin’s victims include hospitals and public bodies that were always going to announce a refusal. But the pattern across the whole table, high rates for the encryption-era brands and low rates for the extortion-era ones, is consistent with what Coveware sees in its own negotiations: victims pay to get systems back, and pay far less readily to keep data off a leak site.
What the payers paid, and what the refusers walked away from
| Outcome | Cases with a figure | Median figure | Mean figure | Largest |
|---|---|---|---|---|
| Ransom paid | 11 | $170,000 | $1.89 million | $18 million |
| Ransom refused | 47 | $661,400 | $3.36 million | $100 million |
A ransom figure is on the record for 134 of the 244 paying incidents and 331 of the 1,504 refusals. The figure is what the source reported, which is usually the demand and sometimes the sum actually transferred, so treat the two rows as demand-sized rather than as receipts. The medians are the useful part: $250,000 where the victim paid, $700,000 where the victim refused. Victims pay the smaller demands and walk away from the larger ones, and the mean for paid cases, $2.2 million, is pulled up by a handful of very large settlements rather than by the typical case. The largest disclosed payment in the dataset is $75 million; the largest refused demand is $200 million.
How this compares with Coveware and Chainalysis
Coveware, the negotiation firm now owned by Veeam, publishes a payment rate from its own caseload. It reported 85% of its clients paying in the first quarter of 2019, 34% by mid-2023, 23% in the third quarter of 2025, and a further record low in the second quarter of 2026, when only 15% of victims facing data theft alone paid. Chainalysis, which tracks the money on-chain, put total ransomware payments at about $820 million in 2025 against $892 million in 2024, an 8% fall in a year when claimed attacks rose by half.
Those figures are higher than ours and they should be. Coveware counts every engagement, including the private companies that pay and never speak. We count only what reached the public record, where refusals are over-represented. The two series measure different populations, and the fact that both have fallen by roughly the same proportion since 2019, from 85% to the low twenties in Coveware’s sample and from 29% to single digits in ours, is the strongest evidence that the change is real rather than an artefact of either method.
Why victims stopped paying
Four things changed between 2019 and 2026, and the dataset shows their fingerprints. Recovery got cheaper: immutable backups and rehearsed rebuilds mean encryption alone no longer forces a payment, which is why the groups that still encrypt competently, Akira among them, keep a higher rate than the ones that only steal. Paying got riskier: the US Treasury’s 2020 sanctions advisory, updated in 2021, made facilitating a payment to a sanctioned operator a legal exposure in its own right, and insurers began requiring controls before they would fund one. Paying got banned for some: North Carolina and Florida barred state and local government bodies from paying in 2022, and the United Kingdom announced in 2025 that it would extend a similar ban across the public sector and critical infrastructure. And paying stopped working for data: once the extortion is about a leak rather than a decryptor, the victim is buying a promise from a criminal, and enough victims have watched their data leak anyway that the promise is now discounted to near zero.
The operators noticed. The move to pure data extortion and the growth of direct resale on leak sites are what a business does when its customers stop paying: it finds other buyers. That is the reading of the falling payment rate that should worry defenders most. Fewer payments have not meant fewer attacks, and the data that used to be held for ransom is increasingly simply sold.
Method and definitions
An incident enters the dataset only when confirmed by at least one independent public source; leak-site listings alone do not qualify. The payment field takes one of three values. “Yes” means a public source states that a ransom was paid by or on behalf of the victim. “No” means a public source states that no ransom was paid, that the victim refused, or that it recovered without paying. “Unknown” means no public statement exists and is excluded from every rate on this page. Ransom figures are recorded as reported by the source, in US dollars, and may be the demand or the sum paid. Rates for any group with fewer than 20 known outcomes are not shown. The dataset refreshes weekly and the tables recalculate on each load; the prose above reflects the database as of 4 September 2026. Cite as: Ransomnews Confirmed Ransomware Attacks Dataset, ransomnews.com, with a link to this page. Bulk access and methodology questions: [email protected].
Frequently asked questions
What percentage of ransomware victims pay the ransom?
Among confirmed ransomware attacks where the victim’s decision is on the public record, 7.6% paid in 2025 and 8.8% so far in 2026, down from 29.3% in 2018, according to the Ransomnews Confirmed Ransomware Attacks Dataset. Coveware, which counts its own negotiation caseload including victims that never disclose, reported 23% paying in the third quarter of 2025 and a further record low in mid-2026. The true rate sits between the two, because victims who pay are the least likely to say so.
What is the ransomware payment rate in 2026?
8.8% of confirmed victims with a public outcome had disclosed paying as of early September 2026, on 57 known outcomes, so the figure will move as the year fills in. Coveware’s caseload rate for the second quarter of 2026 was a record low, with 15% of victims paying when data theft was the only threat.
Why is this payment rate lower than Coveware’s?
Different populations. Coveware’s rate is drawn from every case it negotiates, including private companies that pay and never speak. The Ransomnews rate uses only incidents where a public source states the outcome, and public bodies announcing refusals are over-represented there. Both series have fallen by roughly the same proportion since 2019, which is why the direction can be trusted even though the levels differ.
Which industry pays ransoms most often?
Law firms, with 12 payments in 31 known outcomes (38.7%), followed by technology and financial services at 23.5% each and healthcare at 17.1%. Utilities (3.6%), manufacturing (8.8%) and government (8.9%) disclose payment least often. Samples for some sectors are small and the rates are disclosed rates, not true rates.
Which ransomware groups get paid least?
Among confirmed victims with a public outcome, no victim of Qilin, INC, RansomHub, Medusa or Vice Society has disclosed paying. LockBit’s disclosed rate is 8.7%. The highest rates belong to older encryption-era operations: REvil at 33.3%, Ryuk at 19.6% and Conti at 14.9%.
What is the average ransom payment?
Where a figure was reported, the median in cases that paid was $250,000 and the mean about $2.2 million, the mean being pulled up by a few very large settlements. The median demand in cases that refused was $700,000. Coveware reported a median payment of $150,000 and a mean of $1.88 million for the second quarter of 2026.
Is it illegal to pay a ransomware demand?
In most countries paying is not itself a crime, but it can be. Payments to sanctioned operators expose the payer to sanctions enforcement, which the US Treasury’s OFAC set out in advisories in 2020 and 2021. North Carolina and Florida bar state and local government bodies from paying, and the United Kingdom announced in 2025 that it would ban payments by public sector bodies and critical infrastructure operators. Check the operator’s sanctions status and local law before any payment, and involve counsel; this is general information, not legal advice.
Has the fall in payments reduced ransomware attacks?
No. Confirmed attacks in the dataset ran at roughly 1,450 to 1,550 a year from 2023 to 2025 while the disclosed payment rate fell to single digits, and Chainalysis reported claimed attacks rising by half in 2025 as payments fell 8%. Operators have responded by moving to pure data extortion and selling stolen data directly rather than by attacking less.
Sources and further reading
- Ransomware statistics: confirmed attacks by month, the dataset behind every figure on this page, and the confirmed attacks by sector, country and year index with the incident lists behind each rate.
- Coveware by Veeam, Ransomware payment trends, Q2 2026: record-low payment rate, 15% for data-theft-only cases, median payment $150,000.
- Coveware Q3 2025 payment rate of 23%, as reported by HIPAA Journal; the 85% figure for Q1 2019 and 34% for Q2 2023, as reported by TechTarget.
- Chainalysis, Crypto Crime Report 2026: ransomware: $820 million in payments in 2025 against $892 million in 2024.
- Related Ransomnews analysis: the shift to pure data extortion, 62% of database ransom wallets were never paid, and tracing ransom payments on-chain.
- Verifying a leak before it becomes a headline: the breach verification desk tests whether a listing is real, old, scraped or fabricated.
- Group profiles with confirmed-victim histories: Ransomnews threat group catalogue.